Fixing a Wine compatibility bug — Part 1
I use an excellent program called Cut2D by Vectric for generating toolpaths for CNC milling, and SVG files for laser cutting. I find it much simpler to use than other programs, but still does everything I need for 2D machining. If only their more advanced programs (VCarve, Cut3D, etc) weren’t so expensive for hobby use!

However, it’s a Windows app, and I’ve been running it in a VM for a while, which is not a great experience. Recently, given how well LTSpice works, I thought to try it under Wine, and unsurprisingly, Cut2D works well too! Wine is a program that lets you run Windows apps on a large number of other platforms, by providing a clean room implementation of…well…most of Windows.
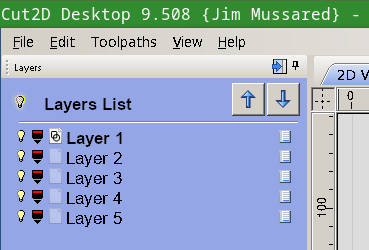
Amazingly, almost everything works perfectly, from the 3D visualization of toolpaths to the drawing interface, except for one minor detail — in the layer list, you can’t toggle layer visibility or select a layer colour. Also if you change either from somewhere else in the program, the list didn’t update. This didn’t particularly bother me until I started using it for laser cutting, because the software I use uses the layer colour to group operations.
So, this is the tale of trying to get that fixed in Wine. If you’re interested in fixing your own compatibility bug, then this will hopefully give you some pointers on how to get started. This is part 1, figuring out what’s going on and learning about Wine. I’ll add more parts and link them here as the journey progresses!
- Part 1 (this article) — Intro to Wine and Windows debugging.
- Part 2 — Reproducing the issue in a simple app. (coming soon!)
- Part 3 — Adding a conformance test for the issue. (coming soon!)
- Part 4 — Fixing the bug. (coming soon!)
Wine is an incredibly complex and amazing piece of software! I was already in awe of it since I first tried running Starcraft in the late 1990’s, but now having seen some small parts of how the sausage is made, I’m even more impressed.
Step 1 — Research
I found the same bug recorded against VCarve, which is a similar but more powerful version of Cut2D, built on the same codebase. So at least it’s not just me!
Step 2 — Investigate
First of all, how is this list implemented? It’s likely using the built-in list control, but at this stage we don’t even know what language Cut2D is written in or what toolkits and libraries it uses. Perhaps the list is entirely custom and implemented from scratch by Vectric. As I obviously don’t have the source code for Cut2D, we need some way to figure this out. It’s been about 15 years since I last did any Win32 development, but I remember four things:
- Controls (textboxes, lists, buttons, etc) are called “windows” (confusing, right). To make your own controls you define a “window class” and create instances of them.
- Everything is done by sending messages between windows. A message has an ID, and two payloads: WPARAM (usually a numeric code) and LPARAM (usually a pointer to some message-specific struct). Messages are handled synchronously, and everything is in-process. Messages form the API for a window, instead of methods, windows receive messages.
- Windows have styles (and extended styles) that customise their functionality.
- There’s an amazing tool that comes with Visual Studio called Spy++ that lets you explore the window hierarchy and trace messages. It’s the “View Source” of Win32 development. In the early 2000s we used to try and guess whether programs were written in VB6, Delphi, MFC, .Net/WinForms or raw Win32 and Spy++ was the easiest way to check because the various frameworks had telltale signs in their class names (e.g. everything in VB was “TButton”, etc — T for Thunder).
These days Visual Studio is free! So I downloaded Visual Studio 2017 Community Edition in a Windows 10 VM and selected the minimum packages to get Spy++: Visual Studio C++ core features. It has a handy “Find Window” feature where you drag a target over the window you want to investigate and it finds that window in the hierarchy (similar to the Web Inspector in Chrome). Spy++ runs great under Wine.
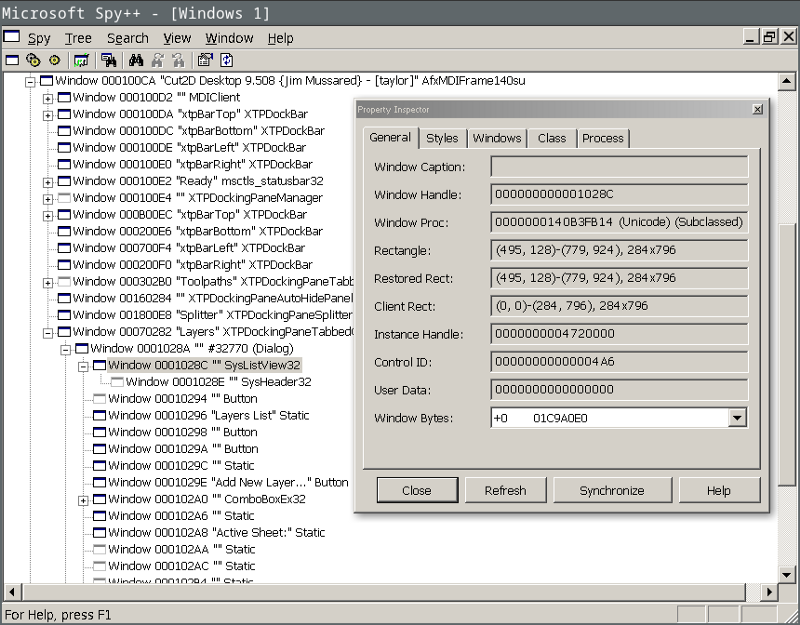
Great! “SysListView32” is the class name for the ListView control (not to be confused with “ListBox” which is the simple list control). These come with Windows in the Common Controls library (comctl32.dll / commctrl.h). (You can confirm this by grepping the Wine source, searching MSDN, etc).
Let’s look at the messages when the layer visibility bulb icon is clicked.
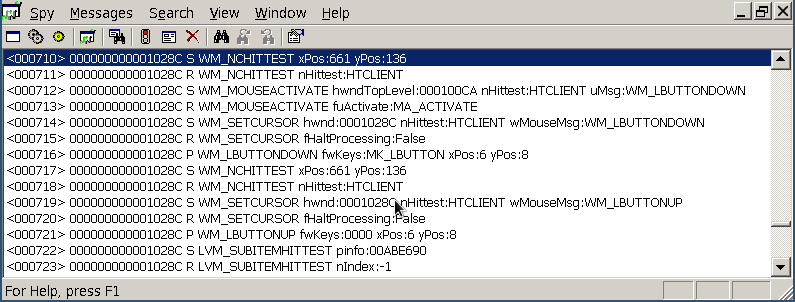
710–716 are the mouse down, 171–723 are the mouse up. It wasn’t particularly obvious to me at the time, but the issue is in message 723: The hit test returns nIndex -1 (i.e. no item).
Let’s compare the same thing running under Windows.
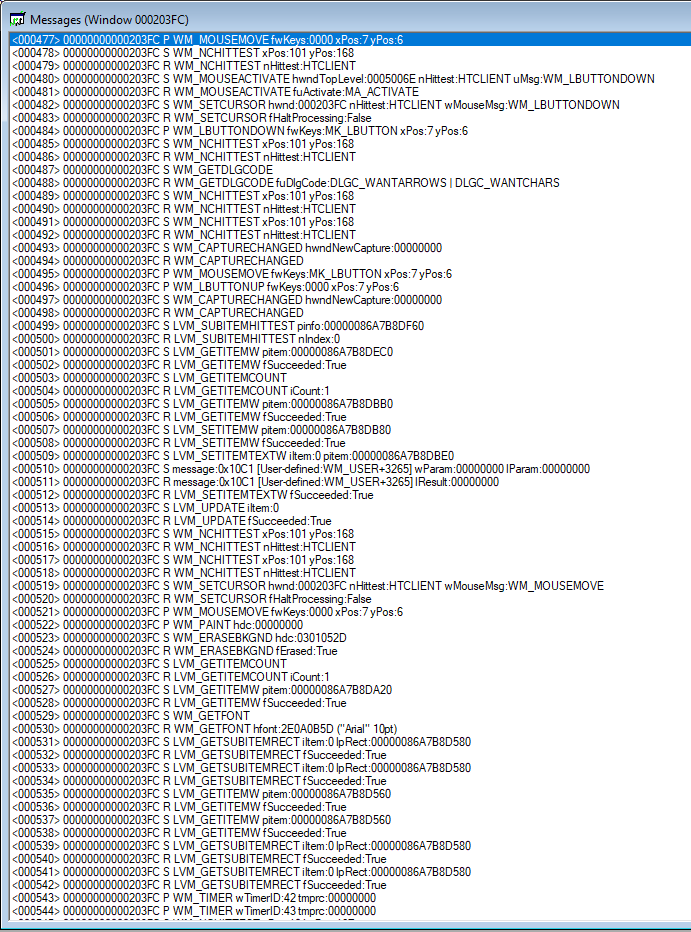
This doesn’t paint a complete picture, it’s also useful to see the WM_NOTIFY messages being sent to the parent (the docked Layer Dialog). Clearly it’s worth investigating what’s (not) happening in Wine.
- The ListView is getting the mouse events.
- WM_NOTIFY events arrive at the parent for both mouse up and down.
- Somehow the parent isn’t able to detect that it corresponds to a click on the layer visibility icon.
Step 3 — Build Wine from source
Eventually we’re going to want to use the debugger, so we’re going to need symbols and source. I have Wine 3.16 binaries from the Arch Linux package. Some distros have a source package, but in my case it was easier just to clone the Git repo.
cd src/winehq.org
git clone git://source.winehq.org/git/wine.git
./configure --enable-win64 CFLAGS="-Og -g"
make
Enabling Win64 mode allowed me to use my existing ~/.wine directory, and -Og -g enables debugging. It takes a long time to build (y’know…every Windows library) but worked.
While that was building, I took some time to read the ListView implementation at dlls/comctl32/listview.c. I also thought it would be useful to consult my 15 year old copy of Petzold’s Programming Windows 5th Edition but sadly I could not find anything about ListView in there. So glad it’s been taking up space on my shelf all that time.
We’ll talk about this in a later part, but Wine (like QEMU, Linux Kernel, etc) doesn’t use a pull request system (like GitHub), instead works by sending patches by email. I’m so used to pull requests (and so spoiled by the time spent using Google’s internal code review tools that make even GitHub seem primitive) that this seems really backwards to me, but that’s just a familiarity thing and I need more experience.
Anyway, Wine mirrors their git repo to GitHub, so that provides a convenient way to manage my own work. I forked the mirror repo and added it as a remote to my local repo.
git remote add jimmo git@github.com:jimmo/wine.git### Step 4 — Debugging
I used two of Wine’s debugging tools — the first, the WINEDEBUG envionment variable allows you to enable tracing, the second is winedbg, which is Wine’s interactive line-by-line debugger (like gdb or windbg).
Throughout all of the Wine source code, there are TRACE (and WARN, etc) statements. These are hidden by default, but controlled by the WINEDEBUG variable. You don’t need to build from source for this, winedbg comes with the binary distribution, but now that we’ve built from source we can add our own TRACE statements. You can read more about how to configure WINEDEBUG here, but for our purposes, we just need to enable the listview channel (see the top of listview.c where it sets WINE_DEFAULT_DEBUG_CHANNEL(listview); ).
make env WINEDEBUG=listview ./wine ‘C:\Program Files\Cut2D Desktop 9.5\x64\Cut2DDesktop.exe’Note that the ./wine script at the top level of the Wine repo doesn’t work the same as the wine binary installed by your distro. It’s a wrapper for finding the locally built version of wine (default) or winedbg (optional second arg, see below).
I recommend commenting out the TRACE at the top of WndProc otherwise the output is very noisy. Here we can see the start of the trace for clicking on the layer bulb.
0051:trace:listview:LISTVIEW_WindowProc (hwnd=0x101d0 uMsg=201 wParam=1 lParam=50007)
0051:trace:listview:LISTVIEW_LButtonDown (key=1, X=7, Y=5)
0051:trace:listview:notify_hdr (code=-16)
0051:trace:listview:notify_hdr <= 0
0051:trace:listview:LISTVIEW_HitTest (pt=(7,5), subitem=1, select=1)
0051:trace:listview:LISTVIEW_GetOrigin nHorzPos=0, nVertPos=0
0051:trace:listview:LISTVIEW_GetOrigin origin=(0,0)
0051:trace:listview:LISTVIEW_HitTest lpht->iSubItem=1
0051:trace:listview:LISTVIEW_HitTest lpht->flags=0x0
0051:trace:listview:iterator_frameditems (lprc=(7,5)-(8,6))
0051:trace:listview:LISTVIEW_GetOrigin nHorzPos=0, nVertPos=0
0051:trace:listview:LISTVIEW_GetOrigin origin=(0,0)
0051:trace:listview:iterator_frameditems_absolute (frame=(7,5)-(8,6))
0051:trace:listview:iterator_frameditems_absolute report=[0, 1]
0051:trace:listview:LISTVIEW_HitTest lpht->iItem=0
0051:trace:listview:LISTVIEW_GetItemT (item={iItem=0, iSubItem=1, state=0, stateMask=f000, pszText=L"", cchTextMax=260, iIndent=0}, isW=1)
0051:trace:listview:LISTVIEW_GetItemT mask=19
...
This is extremely useful to start understanding the code flow.
Next up is winedbg. I ended up having some difficulty getting reliable variable inspection, so using it in conjuction with TRACE was useful.
env WINEDEBUG=listview ./wine winedbg 'C:\Program Files\Cut2D Desktop 9.5\x64\Cut2DDesktop.exe'
WineDbg starting on pid 002e
0x000000007bc96cc9 DbgBreakPoint+0x1 in ntdll: ret
Wine-dbg>**c**
0030:fixme:ver:GetCurrentPackageId (0x2d3fdc0 (nil)): stub
002f:fixme:ntdll:NtLockFile I/O completion on lock not implemented yet
Ctrl-C: stopping debuggee
Ctrl-C: stopping debuggee
0x00007f2c843a8182 __libc_read+0x42 in libpthread.so.0: syscall
Wine-dbg>**break LISTVIEW_HitTest**
002d:fixme:dbghelp_dwarf:dwarf2_parse_const_type Unsupported children
002d:fixme:dbghelp_dwarf:dwarf2_parse_const_type Unsupported children
002d:fixme:dbghelp_dwarf:dwarf2_parse_const_type Unsupported children
Breakpoint 1 at 0x00007f2c819f28c8 LISTVIEW_HitTest [/home/jimmo/src/winehq.org/wine/dlls/comctl32/listview.c:7619] in comctl32
Wine-dbg>
If you’re familiar with gdb you’ll have no trouble with winedbg. The usual commands continue, step, next, break, list, print, etc (and their one-letter shortcuts) work in the same way.
As with WINEDEBUG this was extremely useful to figure out how the code worked.
Step 5 — Items and SubItems.
From reading the code, I learned the following about how ListView works.
- The list view can be in different modes (icons, small icons, details (grid), etc). If you imagine the different ways that Windows Explorer can show files. This list is in details mode (LV_VIEW_DETAILS).
- There is a single item per row, but items can optionally have subitems that will be shown in details (grid) view in additional columns.
- In details mode, only the item is selectable by default. The subitems don’t activate selection. You can enable an extended style, LVS_EX_FULLROWSELECT, that turns on full row selection. The layer list doesn’t have this style (check in Spy++). This makes understanding how subitem mouse handling works a bit complicated.
- SubItems can be text or images, and it supports “state images” where you have a list of images corresponding to states, rather than setting the image you set the state. (This lets you do things like custom checkbox-style subitems).
- The mouse event handlers use the hit test (also accessible via the LVM_HITTEST message) to find which item and subitem has been clicked on, but in the case of clicking on a subitem, it seemed to always set the item to -1, because it thinks the click was outside the bounds of the item.
At this point I made a huge mistake! Without fully understanding the problem I found a code change (disabling that bounds check) that made Cut2D start working. While it made this very specific case go away, it wasn’t understanding the real problem. However, in my excitement, I forgot all that and jumped right ahead to commenting on bugs and sending patches. *Don’t do that!! **That said — I was really excited to see the layers toggle visibility… progress!*
Anyway, my patch was (very) promptly commented on and the reply was extremely polite given that I stuffed up the patch format (thanks GMail…) and the incorrectness of the patch. Very embarrassing.
Tune in for part 2 where we attempt to do this properly…